| Purpose | Perform apoptosis assay on MDA-MB-231 and Jurkat cells |
| Existing Method(s) | Flow cytometry |
| Target Cell Type | MDA-MB-231 and Jurkat cells |
| Experiment Plan | Scan plate using Green and Bright field channels |
| Hypothesis | By measuring the number of Caspase 3/7 positive cells, we can determine the counts of apoptotic cells in the population |
Celigo Setup
| Plate Type | 96-well Greiner 655090 black wall clear bottom |
| Scan Channels | Green and Bright field |
| Resolution | 1 µm/pixel |
| Scan Area | Whole well |
| Analysis Method | Target 1 + 2 |
| Scan Frequency | 0h, 2h, 4h, 6h and 8 hours |
| Scan Time | ~15 minutes |
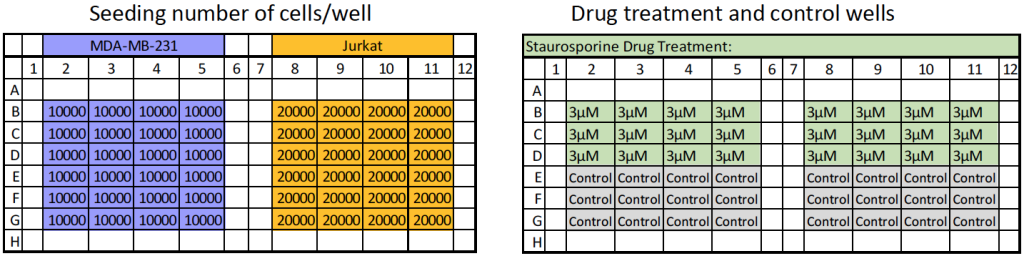
Assay Protocol and Plate Setup
Goal:
Detect and quantify apoptotic cells using Caspase 3/7 staining in adherent MDA-MB-231 and suspension Jurkat cell lines
Protocol:
- Seeded MDA-MB-231 at 10,000 cells/well and allowed to incubate overnight
- Seeded Jurkat cells at 20,000 cells/well on the day of the experiment
- Added Staurosporine at 3 µM final concentration and Caspase 3/7 substrate at 4 µM final concentration per well and allowed to incubate for 8 hours at 37° C
- Imaged the plate every two hours using the Celigo image cytometer for a total of 8 hours
Plate Setup
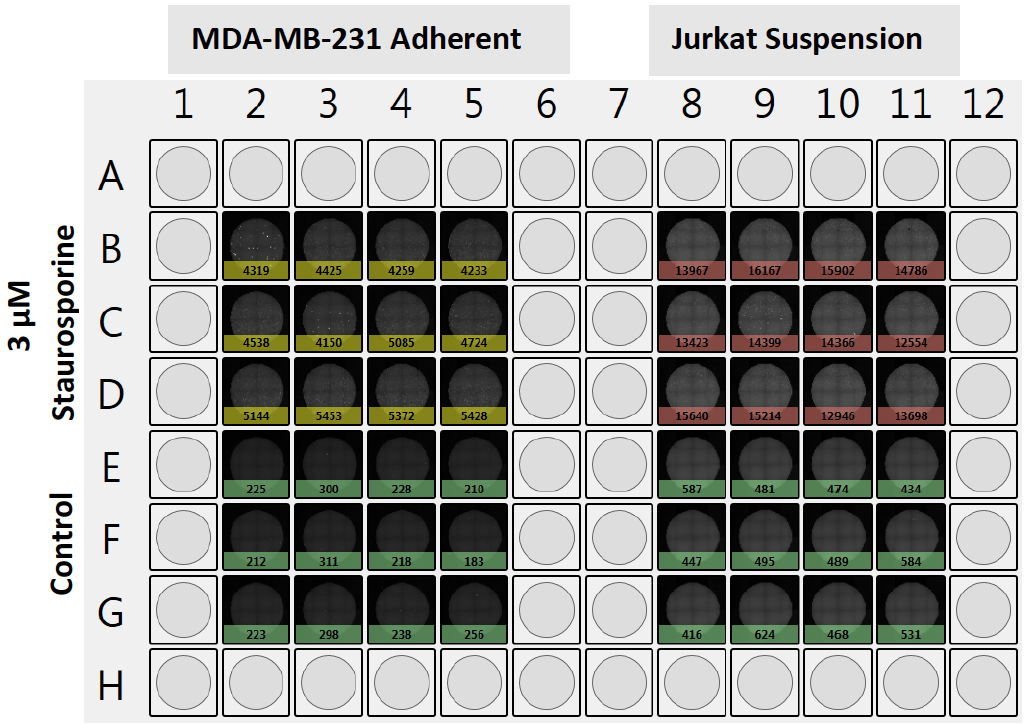
Results
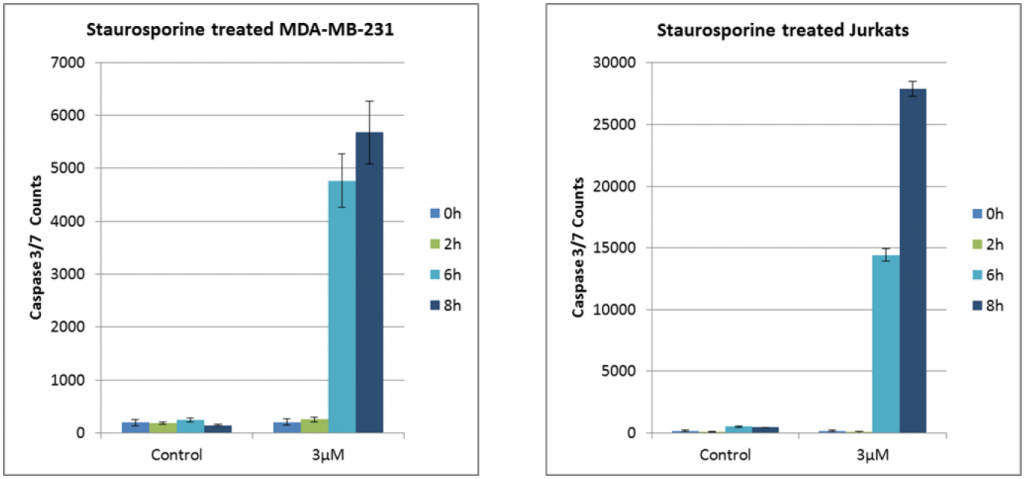
Drug-treated MDA-MB-231 and Jurkat cells showed an increase in Caspase 3/7 positive cells
- Bright field images were captured to monitor cell health and morphology
- The total number of apoptotic cells was determined by counting the cells stained with green Caspase 3/7 reagent
Plate-Level View allows for quick observations of the total number of green Caspase 3/7 positive cells. Shown below are typical results of apoptotic (Caspase 3/7 positive) cells after 8 hours of drug treatment.
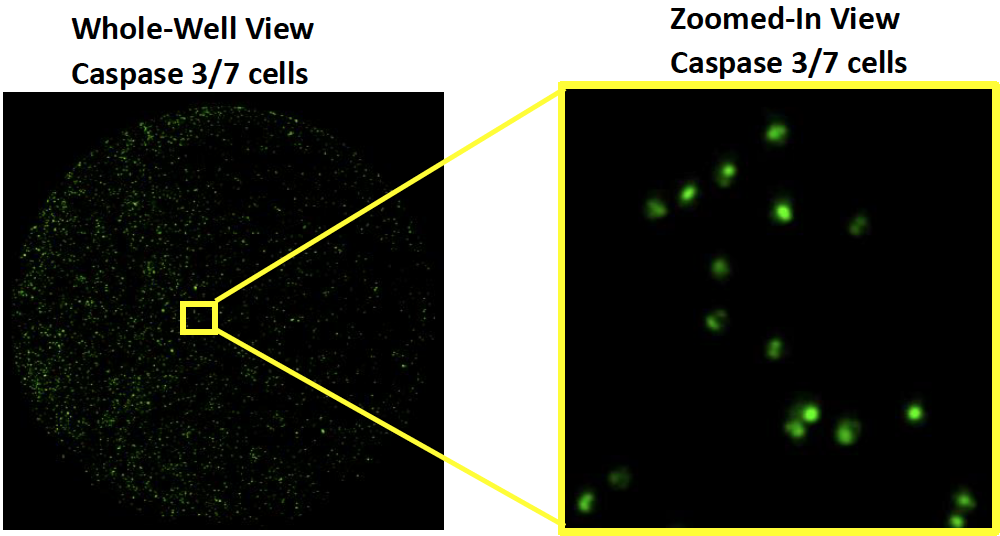
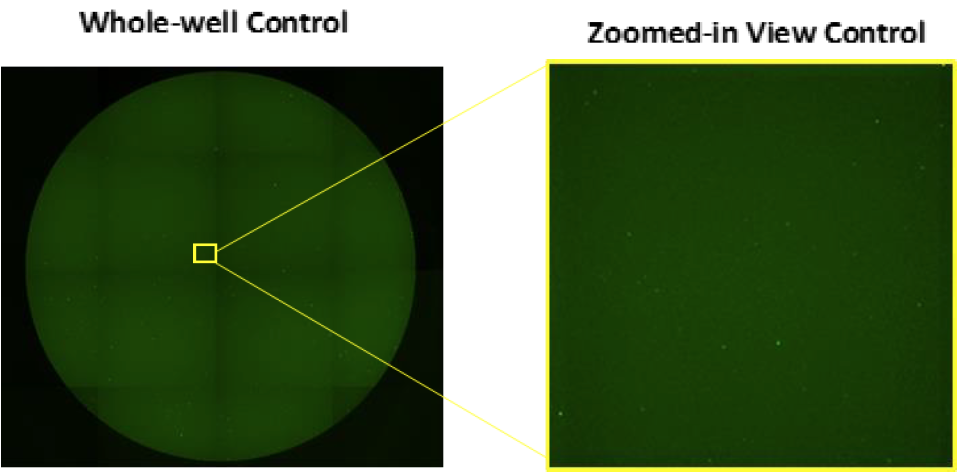
Whole-well view allows for observation of high-resolution images.
Graphs
- In Microsoft Excel, create averages and standard deviations of the control and drug-treated wells.
- Generate a “Bar graph” comparing 3 µM Staurosporine to the control over 8-hour time course. In this example, the average of 12 data points were plotted.
Conclusion
- The Celigo successfully performed Caspase 3/7 apoptosis assay using MDA-MB-231 and Jurkat cell lines
- Acquisition of high-resolution bright field and green Caspase 3/7 fluorescent images of an entire 96 well plate took ~ 15 minutes
- Performing kinetic apoptosis assay using Caspase 3/7 allows for the enumeration of Caspase 3/7 positive cells over the time