Accurately Count PBMCs & Measure Viability without Lysing RBC
Introduction to Peripheral Blood Mononuclear Cells (PBMCs)
Working with peripheral blood mononuclear cell (PBMC) samples can be tricky. Many users currently use a hemocytometer and light microscopy to manually count their PBMCs. However, standard light microscopy cannot consistently distinguish between leukocytes and red blood cells (RBC). As a result, this manual method can result in an over-reported concentration and viability determination of the sample. Additionally, the biconcave shape of RBCs can only be identified with a special optical setup, focusing technique and trained operator. Another challenge tends to be a wide variation from sample to sample in the degree of RBC and platelet contamination. This adds to the difficulty to have one set of conditions to count and measure viability quickly and simply.
Overview of PBMC Cell Counting Challenges
Large amount of users still use hemocytometer and light microscopy to manually count PBMCs
Standard light microscopy cannot consistently distinguish between leukocytes and RBCs
- The biconcave shape of RBCs can only be identified with special optical setup, focusing technique and trained operator
Bright field image

Wide Variation in Samples
From sample to sample, the degree of RBC and platelet contamination vary, thus making it difficult to have one set of conditions to count and measure viability quickly and simply.

Accurately Count PBMCs and Measure Viability in the Presence of Residual RBC
Importance of Accurate Counts and Viability
Peripheral blood mononuclear cells are used to measure immunological functions. Assays include proliferation, cytotoxicity and cytokine production. The use of cryopreserved PBMCs is critical both in clinical trials and biomedical research.
In cancer immunotherapy, leukapheresis is often used to isolate immune system cells from a patient’s blood. Cells are then expanded or exposed to different agents depending on the vaccine design. Active cells are then infused back to the patient. Cell concentration and viability are essential parameters to monitor throughout the manufacturing process.
Ficoll is routinely used to isolate mononuclear cells from bone marrow, peripheral blood, and umbilical cord blood. Monocytes and lymphocytes form a buffy coat under a layer of plasma. Cells are collected and washed. Typically, some residual platelets or red blood cells are mixed in the mononuclear cells.
The functional assays on cryopreserved PBMC are associated with viability of the cells. Viability thresholds should be used in clinical trials in order to obtain reliable results of functional assays.
Characteristics of PBMC experiments
- Cell quality degrades with time
- Large number of samples typically associated with clinical trials
- Cell sample are not pure, separation quality depends on patient sample and operator
Live PBMC concentration and viability are routinely measured for cell separation, processing and cryopreservation
- Label magnetic beads for cell separation
- Antibody labeling and staining for fluorescent active cell sorting and analysis
- Cryopreservation before adding cryo-cocktail
- Quality control after thawing
Options to consider for obtaining accurate PBMC cell counts
Method to Eliminate Red Blood Cell Induced Counting Error
Identification of Residual RBC in Fresh Human PBMC Samples
Method:
Image samples using a fluorescent Cellometer automated cell counter and manually count RBC and leukocytes
Procedure:
- Pipette 20 µl of fresh sample into a Cellometer disposable cell counting chamber
- Set up Cellometer with bright field only imaging method
- Adjust focus to identify the biconcave morphology of the red blood cells
- Capture cell images from 4 locations of the counting chamber
- Print out cell images
- Manually enumerate cells with and without biconcave morphology. Platelets are not counted, as indicated by the much smaller cell size.
Residual presence of red blood cells in a PBMC sample post RBC lysis

From the captured bright field image manual identification of RBCs (circled in red) and white blood cells (circled in blue). These residual RBCs can lead to an inaccurate count during manual counting of PBMC samples.
Results for 15 fresh human PBMC samples:
- 4 samples showed a high degree of RBC contamination (Greater than 30%)
- 6 samples showed a moderate degree of RBC contamination (10% to 30%)
- 5 samples showed low or no RBC contamination (Less than 10%)
RBC Contamination % = RBC Count / Total Cell Count (x100)
Data of RBC Contamination in 15 PBMC Samples
")
Number of cells with and without bi-concave morphology for 15 fresh human PBMC samples. This clearly shows that the amount of residual RBC varies from sample to sample, ranging from 0% to 50%.
Accurate Dual-Fluorescence Analysis of PBMC Samples without Lysing of RBCs
Nexcelom has optimized a dual-fluorescence staining method for simple, accurate determination of concentration and viability. Samples stained with AO/PI can be analyzed with the Cellometer Auto 2000, or Cellometer K2 instruments using pre-optimized settings for PBMC analysis.
Acridine orange (AO) and propidium iodide (PI) are fluorescent nucleic acid stains that have been used to measure nucleated cell viability in various cell types, including mammalian cell lines, mammalian primary cells, and yeasts.
- AO is a membrane-permeable dye that stains nucleated viable cells green.
- PI is a membrane-impermeable dye that stains membrane compromised (non-viable) nucleated cells red.
- The non-viable cells are actually stained by both AO and PI. Due to fluorescent resonance energy transfer (FRET), the AO fluorescent energy is transferred to PI, allowing non-viable cells to only fluoresce red.
- Ethidium bromide can be used in place of propidium iodide
AO/PI stained sample without RBC lysis
")
| Live PBMC | Dead PBMC | RBC/Platelet | |
|---|---|---|---|
| Acridine Orange (AO) staining | Positive green stains | Positive green stains | No stain/No stain |
| Propidium Iodide (PI) staining | No stain | Positive red stain | No stain/No stain |
Because platelets and mature red blood cells do not have a nucleus, they are not stained by nuclear staining dyes.
With the dual-fluorescence method, there is NO counting error from RBCs, platelets, or debris. Lysis of RBCs is not necessary.

While the bright field image shows the presence of RBC, they were not stained or counted by the Cellometer software
Validation of AO/PI Dual Staining Method for Total Nucleated Cell Count
A. Directly measure total nucleated cells using AO/PI staining and Cellometer automatic cell counter
- Stain sample with AO/PI at 1:1 ratio
- Load 20 µl stained cell sample into the counting chamber
- Count and analyze PBMC sample using a fluorescent Cellometer cell counter
B. Count total nucleus from sample
- Lyse the same sample using 3% acetic acid for 15 min to release nucleus
- Stain nucleus with trypan blue (TB)
- Manually count trypan stained nucleus under an optical microscope using hemocytometer
Sample Preparation

C. Compare total number of trypan stained nucleus to directly measured nucleated cells using AO/PI
- Samples were counted. Results showed comparable counts between AO/PI stained PBMC and the trypan blue stained nucleus, indicating AO/PI stained cells are nucleated PBMCs.
Counting Results

Comparison of PBMC Count Using AO/PI Method to Manual Leukocyte Count
A. Directly measure total nucleated cells using AO/PI staining and Cellometer automatic cell counter
- Stain fresh human sample with AO/PI (20ul cell sample + 20ul AO/PI)
- Count and analyze sample using a fluorescent Cellometer cell counter
- Record the AO/PI cell count and sample ID
- Compare AO/PI to leukocyte count reported in Figure 2
B. Compare AO/PI cell count to RBC and Leukocyte count performed earlier.
Results
Comparable leukocyte counts are obtained between AO/PI and manual counting for all the samples. (equal length of the green bar and the blue bar)
The difference between cell count using the manual method and the AO/PI method equals to the amount of RBCs for each sample.
It is conclusive that AO/PI staining can eliminate the error induced by residual RBCs in manual counting method.
Comparable Leukocyte Counts Between AO/PI and Manual Counting

AO/PI Assay Performance – Counting Range, Repeatability and Consistency
Measure cell concentration linearity and consistency using fresh PBMC
- Produce sample with serial dilution using PBS
- Stain sample at each dilution with acridine orange and ethidium bromide mixture (or AO/PI mixture)
- Load 10 Cellometer counting chambers for each dilution
- Measure live / dead cell concentration and viability using a fluorescent Cellometer cell counter
- Measured from live cell concentration of 2×10⁷ to 2×10⁵.
- Coefficient of variation ranged from 3.5% to 14.1%, which are in the acceptable range.
PBMCs dilution series showed linearity of R2 = 0.9991

PBMC dilution series results
| Dilution factor | Live (cells/ml) | Std (n=10) | %CV |
|---|---|---|---|
| 1 | 2.2E+07 | 7.6E+05 | 3.5 |
| 0.5 | 1.1E+07 | 3.4E+05 | 3.0 |
| 0.25 | 5.0E+06 | 2.4E+05 | 4.8 |
| 0.125 | 2.6E+06 | 1.6E+05 | 6.2 |
| 0.0625 | 9.7E+05 | 5.3E+04 | 5.4 |
| 0.03125 | 4.1E+05 | 5.6E+04 | 13.9 |
| 0.015625 | 2.1E+05 | 2.9E+04 | 14.1 |
Time-Course Measurement of Fresh PBMC Viability Using AO/PI
Fresh sample was stored at 4°C. At day 1, day 4 and day 7, cell sample was removed for viability measurement at each time point, using the following procedure:
- Stain cells with acridine orange and ethidium bromide mixture (or AO/PI mixture)
- Load 10 Cellometer counting chambers for each dilution
- Measure viability using a fluorescent Cellometer cell counter

When fresh PBMCs sample was stored in 4°C, viability was reduced with storage time.
Choosing the Right Cellometer for PBMC Cell Counting
Dual-fluorescence analysis is a superior PBMC cell counting method that produces simple accurate results when used with an automated cell counter.
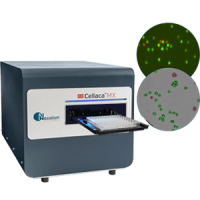
The Cellometer Auto 2000 Cell Viability Counter , Cellometer K2 , Cellometer Spectrum Image Cytometry System, and the Cellaca MX are optimized for accurate analysis of PBMCs in samples with RBC contamination both pre- and post-cryopreservation. Both systems can also be used to determine TNC concentration and viability in fresh blood samples prior to Ficoll separation.
Cellometer bright field cell counters, including the Cellometer Mini, Auto T4, and Auto 1000, can be used to accurately measure Trypan Blue viability for cultured PBMCs.
- They can also be used to analyze fresh and cryopreserved PBMC samples following lysis of RBCs.
| Cellometer Mini | Cellometer Auto T4 | Cellometer Auto 1000 | Cellometer Auto 2000 | Cellometer K2 | Cellometer Spectrum | |
|---|---|---|---|---|---|---|
| Cultured PBMCs – no debris | ||||||
| Cultured PBMCs – debris | ||||||
| Fresh PBMCs w/ lysing of RBCs | ||||||
| Fresh PBMCs without lysing | ||||||
| Frozen PBMCs |
![]() = excellent
= excellent ![]() = very good
= very good ![]() = good
= good ![]() = not recommended
= not recommended
Conclusion
Current PBMC enumeration method using Hemacytometer and light microscopy can include donor-dependent RBC-induced counting error.
Cellometer image cytometer was used to eliminate the RBC-induced counting error by automatically enumerate AO/PI-stained nucleated cells.
References
Preliminary Report: Evaluation of Storage Conditions and Cryococktails during Peripheral Blood Mononuclear Cell Cryopreservation”, L.M. Cosentino, W. Corwin, J.M Baust, N.Diaz-Mayoral, H.Cooley, W. Shao, R. Van Buskirk, and J.G Baust, Cell Preservation Technology, Volume 5 Number 4, 2007
“Viability and Functional Activity of Cryopreserved Mononuclear Cells”, A. Weinberg, L. Zhang, D. Brown, A. Brice, B.Polsky, M. S. Hirsch, S. Owens, and K. Lamb Clincal and Diagnostic Laboratory Immunology, July, 2000, P714-716
“Cell loss and recovery in umbilical cord blood processing: a comparison of postthaw and postwash samples”, V. Laroche, D. H. McKenna, G. Moroff, T. Schierman, D. Kadidlo, and J. McCullough, Transfusion, Vol., 45, Dec. 2005.
“Viability and Recovery of Peripheral Blood Mononuclear Cells Cryopreserved for up to 12 Years in a Multicenter Study”, C. A. Kleeberger, R. H. Lyles, J. B. Margolick, C. R. Rinaldo, J. P. Phair, and J. V. Giorgi, Clinccal and Diagnostic laboratory Immunology, Vol. 6, No. 1, Jan. 1999.
Chan, L.L., Wilkinson, A.R., Paradis, B.D. and Lai, N. (2012b) Rapid Image-based Cytometry for Comparison of Fluorescent Viability Staining Methods. Journal of Fluorescence 22, 1301-1311.
Almeida, C.-A.M., Roberts, S.G., Laird, R., McKinnon, E., Ahmed, I., Pfafferott, K., Turley, J., Keane, N.M., Lucas, A., Rushton, B., Chopra, A., Mallal, S. and John, M. (2009) Automation of the ELISpot assay for high-throughput detection of antigen-specific T-cell responses. Journal of Immunological Methods 344, 1-5.
Constantino, B.T. and Cogionis, B. (2000) Nucleated RBCs – Significance in the Peripheral Blood Film. Laboratory Medicine 31, 223-229.
Laroche, V., McKenna, D.H., Moroff, G., Schierman, T., Kadidlo, D. and McCullough, J. (2005) Cell loss and recovery in umbilical cord blood processing: a comparison of postthaw and postwash samples. Transfusion 45, 1909-1916.
Sigfusson, A. and Souhami, R. (1984) The Effects of Erythrocyte Contamination on Pokeweed Mitogen Induced Immunoglobulin-Synthesis in Man. Journal of Immunological Methods 72, 167-170.
Szabo, S.E., Monroe, S.L., Fiorino, S., Bitzan, J. and Loper, K. (2004) Evaluation of an Automated Instrument for Viability and Concentration Measurements of Cryopreserved Hematopoietic Cells. Laboratory Hematology 10, 109-111.