Direct NK Cell Killing
Quantification of Natural Killer Cell-Mediated Cytotoxicity
- Determine percent cell lysis of target cells
- Flexibility to use NK cells that are purified or in PBMCs
- Produce BF and FL images of direct target cell killing by NK-cells
Non-Toxic Calcein AM Release Assay for Direct NK Cell Killing
Typical NK cell-mediated killing involves accessory signaling or interactions in order to induce NK cell activation and downstream cytotoxicity. NK-cells can be activated by antigen presenting cells and/or multiple cytokines.

To examine direct NK cell-killing, there are two methods. One, the purified NK cells are genetically engineered to identify, bind to and kill target tumor cells. Two, human PBMCs containing NK cells are further stimulated with IL-2 to induce a more robust activation and promote target cell killing.
Traditionally, cytotoxicity assays have been performed using Chromium-51 release, LDH release, Luciferase Reporter Assay and fluorescent release assays (described below).
| Detection Method | Description | Existing Issues |
|---|---|---|
| Radioactivity Release | Measure the release or radiolabels, 51Cr, 101In in the supernatant | Handling hazardous material; Indirect measurement of cell death |
| Fluorescence Release | Measure the release of calcein AM fluorescent molecules in the supernatant | Indirect measurement of cell death; Endpoint assay only |
| LDH Release | Measure the release of cytosolic enzyme in the supernatant | Indirect measurement of cell death; Endpoint assay only |
| Luciferase Reporter Assay | Measure luciferase as the cells die | Indirect measurement of cell death |
| Flow Cytometry | Measure the number of viable cells and viability in the sample | Cannot perform in plates; Must trypsinize for adherent cells |
Alternatively, by labeling the target tumor cells with non-toxic, non-radioactive calcein AM, we can monitor the killing of the tumor cells by the immune effector cells by performing a calcein AM release assay.
Quantification of Natural Killer Cell-Mediated Cytotoxicity
Celigo Experimental Protocol
- IMR32 (Adherent) and K562 (Suspension) target cells were used to demonstrate the NK Cell-mediated cytotoxicity detection method using calcein AM staining for direct cell counting
- Target cells (adherent and suspension) were collected and stained with calcein AM
- Target cells were seeded in 96-well microplates
- Effector cells were added to the wells at different E:T ratios (10:1, 5:1, 2.5:1, 1.3:1, 0.6:1, and 0.3:1)
- The wells were scanned and analyzed using Celigo for direct cell counting calcein AM stained target cells
- Cells at different E:T ratios were imaged at 4 hours after adding effector cells to target cells
- Time-course (t = 1 – 4 hours) was performed to determine percent cytotoxicity by monitoring the reduction in calcein AM stained target cells
- The maximum release uses Triton X100 to lyse all cells and release the calcein AM fluorescent molecules
Experiment Plate Map

Prepared two target cells lines IMR32 and K562. Added effector NK-cells at different E:T ratios.
E:T Ratio and Time-Dependent Cytotoxicity of K562 and IMR32

Representative 4 hour bright field and calcein AM overlay images showing E:T ratio dependent cell killing. calcein AM-labeled target cells are not killed in the control image, while nearly all of the target cells are killed in the 5:1 effector to target cell sample.
Calculating the Percent of Cell Lysis

% Lysis Calculation for Cytotoxicity Measurement
- Count # of live target cells (calcein AM positive) in wells with effector cells
- Count # of live target cells (calcein AM positive) in wells without effector cells (control)
E:T Ratio Dependent NK Cell-Mediated Cytotoxicity (Stained K562 Cell Imaged at t = 4 hr)

The example calcein+ fluorescent images are the K562 target cells at t = 4 hours
The resulting fluorescent images showed increase in calcein AM positive target cells as E:T ratio decreased
E:T Ratio Dependent NK Cell-Mediated Cytotoxicity Results

The percent lysis is plotted to show the effect of E:T ratios on target IMR32 and K562 cells. Live adherent IMR32 cells were directly measured using the Celigo without trypsinization. The number of calcein AM positive cells at t = 4 hrs was used to calculate the percent lysis for each E:T ratio.
Time-Dependent NK Cell-Mediated Cytotoxicity (NK Cell : K562 Cell Ratio (E:T) = 2.5:1 )

Live K562 suspension cells were directly measured using the Celigo image cytometer. The number of calcein AM positive cells was counted at each hour and used to calculate the percent lysis for each E:T Ratio
Time-Dependent NK Cell-Mediated Cytotoxicity Results

The percent lysis is plotted to show the effect of E:T ratios on target IMR32 and K562 cells. Live adherent IMR32 cells were directly measured using the Celigo without trypsinization. The number of calcein AM positive cells was counted at each hour and obtained cell numbers were used to calculate the percent lysis for each E:T Ratio. By analyzing the time course data of IMR32, we can see that there is a large percent lysis difference between the E:T Ratio.
Cytotoxicity Assay using IL-2 Stimulated NK Cells in Patient Donated PBMC Sample
Celigo Experimental Protocol
- The target cells (K562) are stained with 5 µM calcein AM for 30 min
- The target cells were then seeded into the 96-well plate at 10,000 cells/well
- Next, the effector cells were added following the E:T ratios shown on the plate map (below)
- Finally, IL-2 was added to half of the wells to activate NK cells
- The spontaneous release was seen in K562-stained cell without PBMCs
- Maximum release was seen in stained target cells that were treated with a lysing agent
- After adding the cells and IL-2, the plate was centrifuged in order to settle the cells to the bottom of the plate
- Immediately after, the plate was scanned using the Celigo image cytometer
- The scans were acquired at T = 1, 2, 3, and 4 hr

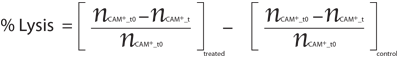
Calculating the Percent of Cell Lysis
-
- The counted number of calcein AM positive target cells with and without effector cells
- The counted number of calcein AM positive target cells with and without IL2
- Normalize to t = 0
![]()
-
- Normalize to spontaneous release
![]()
- The %Lysis is calculated for every well and averaged to generate dose response and time course monitoring
Cytotoxicity Dose Response

A greater percent lysis was observed in samples at a high E:T ratio with IL-2. Overall, even at lower E:T ratios, the percent lysis was greater in samples containing IL-2.
Time Course Monitoring

Percent lysis was observed above the target only control for all samples. Donor samples with IL-2 showed a great percent lysis compared to the no IL-2 samples.