Hepatocytes
Overview of Hepatocytes
 Hepatocytes are the predominant cell in the liver, comprising about 60% of liver cells and 80% of liver mass. Hepatocytes are arranged in plates that branch and anastomose, or interconnect. Most hepatocytes have a single nucleus, but binucleate cells are common. There are approximately 1,000 mitochondria per hepatocyte. Approximately 15% of the cell volume consists of smooth and rough endoplasmic reticulum. There are about 30 lysosomes and 500 peroxisomes per cell. One of the main hepatocyte functions is the production of bile. Hepatocytes are also responsible for the regulation of metabolism, detoxification, and the manufacture of important circulating proteins, making them a critical component of studies involving liver disease, drug metabolism, and toxicology.
Hepatocytes are the predominant cell in the liver, comprising about 60% of liver cells and 80% of liver mass. Hepatocytes are arranged in plates that branch and anastomose, or interconnect. Most hepatocytes have a single nucleus, but binucleate cells are common. There are approximately 1,000 mitochondria per hepatocyte. Approximately 15% of the cell volume consists of smooth and rough endoplasmic reticulum. There are about 30 lysosomes and 500 peroxisomes per cell. One of the main hepatocyte functions is the production of bile. Hepatocytes are also responsible for the regulation of metabolism, detoxification, and the manufacture of important circulating proteins, making them a critical component of studies involving liver disease, drug metabolism, and toxicology.
Importance of Accurate Hepatocyte Counts
Primary hepatocytes are regularly used to measure toxicity of drug candidates during the drug screening process. Most cytotoxicity assays are plate-based assays involving the plating of hepatocytes in each well. Precise and accurate cell concentration and viability measurement are crucial to obtaining reproducible, high quality data.

Multi-well plate
Multi-well plates are used to screen drug candidates at varying concentrations with repeated measurements, generating a large number of data points for analysis and comparison.
Multi-well plates need to be seeded with identical numbers of cells with known viability for correct interpretation of data.
Hepatocyte Challenges & Cellometer Solutions
Due to hepatocytes’ variable morphology, fragile nature, and tendency to clump, traditional manual counting methods can be time-consuming and inaccurate. Because hepatocytes lose viability over time, extended or variable counting times can generate inaccurate and inconsistent viability determinations. Hepatocytes are too fragile to evaluate using flow cytometry due to flow-induced shear stress.
Dual-fluorescence Staining Procedure
For viability determination, 20 µl of hepatocyte sample is mixed with 20 µl of ViaStain™ AO/PI Staining Solution. The acridine orange (AO) dye stains DNA in all nucleated cells, generating green fluorescence and easily differentiating hepatocytes from debris. Propidium iodide (PI) stains DNA in all cells with compromised cell membranes, generating red fluorescence. In cells stained with both AO and PI, the green fluorescence is absorbed by the red fluorescence via FRET (fluorescence resonance energy transfer), so all dead hepatocytes fluoresce red and can be easily counted. The procedure is fast, gentle, and accurate.
Cellometer image cytometry is an ideal method for determination of hepatocyte concentration and viability, overcoming all of the difficult hepatocyte characteristics:
| Hepatocyte Challenge | Cellometer Solution |
|---|---|
| Fragile | Non-fluidic Imaging System |
| Irregular in Shape | Specialized algorithm for counting of irregular (non-round) shapes |
| Variable in Size | User-adjustable size range for counting |
| Form Clusters or Clumps | Proprietary Cellometer Software identifies and counts individual cells within clusters |
| Lose Viability Over Time | Analysis in < 60 seconds |
Bright Field Image & AO and PI Counted Overlay

Cellometer instruments automatically capture and analyze multiple images. Counted live cells are outlined in green, while counted dead cells are outlined in red.
Using this method, many species of hepatocytes have been successfully counted using the Cellometer Vision, including the following:
Human
Mouse
Horse
Rat
Rainbow Trout
Monkey
Dog
- Rabbit
Many more species can be analyzed
Using Acridine Orange/Propidium Iodide (AO/PI) to Measure Cell Concentration and Viability
Immediately after mixing, 20 µl of stained sample is loaded into the Cellometer Counting Chamber and inserted into the Cellometer instrument. The sample is imaged directly from the counting chamber. Because the counting chamber is disposable, no washing is required between samples and there is no risk of cross-contamination. Samples are imaged and analyzed using pre-set parameters for primary hepatocytes. Bright field and fluorescent cell images can be viewed to check cell morphology and verify cell counting. Total cell count, concentration, and mean diameter are automatically displayed.
AO/PI Protocol
- Obtain Nexcelom AO/PI solution: Visit our Reagents Page
- Stain cell sample at 1:1 with AO/PI solution
- Load counting chamber slide and analyze
1. Pipette 20 µl of sample into a disposable slide.

2. Insert slide into the instrument

3. Select assay from a drop down menu

4. Click count, acquire image and view cell count, concentration, diameter

Automated Viability Results
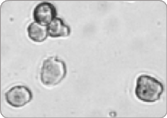
Bright Field and Fluorescent Hepatocyte Images

Bright field image (left) shows the variable morphology of primary hepatocytes. Dual fluorescent image (right) shows counted live hepatocytes (circled in green) and counted dead hepatocytes (circled in red).
Cellometer Hepatocyte Viability Results

Cell images and data can be instantly saved to a secure network or printed directly from the Cellometer software.
Images and tables can be exported to Excel or PowerPoint for further analysis, presentation, or publication.
Automated analysis and reporting eliminates inter-operator variability and potential user errors in counting or recording.
The Cellometer software reports:
- Cell count
- Cell concentration
- Cell viability
- Cell diameter
Conclusions
Cellometer K2, Vision and Vision CBA instruments are ideal for researchers looking to perform accurate viability and concentration measurements of primary hepatocytes. Because of the fragile nature of primary hepatocytes, Cellometer Image Cytometers offer the best method for measuring cell viability while preserving the cell’s health.
Publications Using Cellometer Instruments for Hepatocyte Analysis
- Shan J, Schwartz RE, Ross NT, et al. (2013) Identification of small molecules for human hepatocyte expansion and iPS differentiation. Nat Chem Biol 9(8) 514-520
- Schwartz J, Holmuhamedov E, Zhang X, et al. (2013) Minocycline and doxycycline, but not other tetracycline-derived compounds, protect liver cells from chemical hypoxia and ischemia/reperfusion injury by inhibition of the mitochondrial calcium uniporter. Toxicol Appl Pharmacol 273 172-179
- Wang D, Li L, Yang H, et al. (2013) The constitutive and rostane receptor is a novel therapeutic target facilitating cyclophosphamide-based treatment of hematopoietic malignancies. Blood 121 329-338
- Ashley CE, Carnes EC, Phillips GK, et al. (2011) Cell-Specific Delivery of Diverse Cargos by Bacteriophage MS2 Virus-Like Particles. ACS Nano 5(7) 5729-5745
- Holmuhamedov EL, Czerny C, Beeson CC, et al. (2012) Ethanol Suppresses Ureagenesis in Rat Hepatocytes: Role of Acetaldehyde. J Biol Chem 287(1) 7692-7700
General Hepatocyte References
- Ploss, A., et al. (2010). Persistent Hepatitis C Virus Infection in Microscale Primary Human Hepatocyte Cultures, PNAS. 107(7), 3141-3145. Doi: 10.1073/pnas.0915130107.
- Malarkey, D. et al. (2005). New Insight into Functional Aspects of Liver Morphology, Toxicologic Pathology.33:27-34. Doi: 10.1080/01926230590881826.
- Malhi, H. et al. (2010). Hepatocyte Death: A Clear and Present Danger, Physiol. Rev. 90:1165-1194. Doi: 10.1152/physrev.00061.2009.
- Lu, J.-N., et al. (2011). The Behaviors of Long-term Cryopreserved Human Hepatocytes on Different Biomaterials, Artificial Organs. 35:E65-E72. Doi: 10.1111/j.1525-1594.2010.01191.x.